Data Engineer : How to integrate a graphic into your app with Nodata
Nowadays, business teams increasingly need to integrate data indicators into their daily tools, to make data-driven decisions to be more efficient and relevant.
This digitalization trend affects all sectors in all types of organizations, and teams in charge of these evolutions (data engineers) must proceed methodically.
Here is how Nodata was designed, to maintain datum, while fitting perfectly into every stage of a digital project:

1st stage: Clearly identify the needs of the operational team
Before embarking on any development, it is crucial to clearly identify how data integration responds to a business problem:
- Either by reducing the time spent going back and forth to collect this data in a data set
- Or by simplifying access to data that is usually difficult to reach
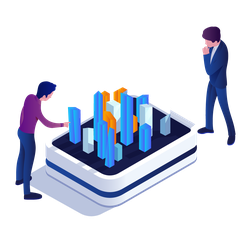
2nd stage: Design and ergonomics to visualize data
Today, the UX/UI approach no longer has anything to prove, there's clearly nothing more frustrating than a powerful and well-built application that doesn't find its audience due to lack of comfort!
Knowing the end-user's habits enables us to build an ergonomic model of the digital application, meeting the functional needs of business teams and integrating a data approach. This model can then be challenged and optimized before launching developments.
3rd stage: Planning and methodology
The development of a new application is often done following an Agile methodology.
The implementations of Agile methodology, such as SCRUM, respect the principle of sprint iterations.
A sprint is broken down into several major steps:
- Development of one (or more) feature(s) previously prioritized in the backlog
- Test
- Integration of the completed functionality into the application
- Feedback from an end-user panel
Then all of these steps are repeated on the next feature(s) until a satisfactory final product is achieved.
Nodata perfectly integrates into these iterative processes thanks to its version management of data components (datablocks and dashboards) and is designed for integration and continuous deployment (CI/CD pipeline).

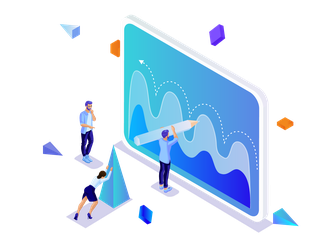
4th stage: Realization
For each sprint of the project, it is necessary, on the data side, too :
- Identify the necessary data sources: thanks to its integrated modeling functionality, Nodata enables you to keep an up-to-date view of the data in the databases.
- Carry out indicator calculations: Nodata allows you to quickly and simply carry out, share and reuse these calculations thanks to the datablocks.
- Create visualization bricks: directly from the Nodata interface, the user can give shape to these indicators and arrange them in accordance with the pre-defined design.
- Integrate into the application: thanks to the Nodata SDK, it is possible to integrate a dashboard directly into the DOM of the host application, unlike the majority of existing analytical solutions which only offer simple iframes. Moreover, it is easy to link the native navigation of the application to the filtering criteria in the dashboard.
- Display customization: All that remains to be done is CSS design so that the display is in line with the brand's graphic charter and fits its environment. Nodata spares its users time-consuming actions such as digital formatting, data label positioning, axis scaling, animation, asynchronous data loading management, development of indicator calculation, performance management, jurisdiction management, etc.

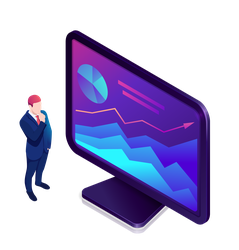
5th stage: Maintenance and scalability
Analytical systems on the market offer little flexibility in the evolution of indicators and dashboards. The slightest change is made by the organization's IT department, or even requires the (billed) intervention of the publisher of the analytical solution in question.
With Nodata, users are freed from these constraints and can freely make changes to the indicators in their tool, without jeopardizing the integrity, spirit, balance, and framework of the application.
It is now possible for non-technical users to modify the indicators integrated into their application, directly from the interface.
The application thus remains as close as possible to business needs and their concrete evolutions.
Conclusion :
Nodata has been designed and developed to meet the needs of its users as accurately as possible.
Designed to be easily integrated at each stage of development of a digital application project, the integration of data indicators and/or dashboards becomes natural for developers.
In addition, every effort is made to enhance the end-user experience and guarantee them autonomy in the evolution of their business needs, thus preserving their time and the lifespan of the application.
Related Articles

Digital projects
Comment améliorer la productivité de votre entreprise grâce à la data visualisation
Les entreprises font une planification et une projection de leurs performances grâce à leurs équipes financières.
Elles partagent les objectifs, mais aussi leurs états d’avancement.
Read the article
Digital projects
How to improve your company's productivity with data visualization
Companies plan and project their performance with the help of their finance teams.
They share objectives and progress reports.
Read the article

Digital projects
Application of RBAC to microservices infrastructures
With the many evolutions of the internet over the past years, the appearance of the cloud, and mobile applications to make our private and professional life easier, the question of simplifying and unifying all our services came up. And it is with these novelties that different technologies, protocols, and paradigms have appeared.